
Sometimes you want to filter things based on the reverse of a slicer you made. This blog post tells you how to do it, but I'm going to put my own twist on it, so that it can be used with a table.
Power BI Exclude data based on Slicer selection
In other words, we want to use a slicer to exclude some data and display all the others.
Step 1:
First, we need to create a disconnected dimension which will be a copy of the dimension used as a slicer, “DimSalesTerritory” in my case.

Step 2:
We then need to create a measure “isExclude” that will be used to find out which rows should be excluded if any.
(Create this measure in the disconnected table)
1 2 3 4 5 6 7 8 9 | isExclude =IF( MAX(DimSalesTerritory[SalesTerritoryRegion]) IN ALLSELECTED('Disconected DimSalesTerritory'[SalesTerritoryRegion]) && COUNTROWS(ALLSELECTED('Disconected DimSalesTerritory')) <> COUNTROWS(ALL('Disconected DimSalesTerritory')), 1, 0) |
The first condition checks which rows should be excluded and the second condition is only used to prevent the measure to exclude everything when nothing is selected.
Here is where what I did diverges from the blog post:
Instead of creating a measure based on the slicer list, I added
isExclude =IF( MAX(FactInternetSales[SalesTerritoryKey]) IN ALLSELECTED('Disconected DimSalesTerritory'[SalesTerritoryKey]) && COUNTROWS(ALLSELECTED('Disconected DimSalesTerritory')) <> COUNTROWS(ALL('Disconected DimSalesTerritory')), 1, 0)Then, put the sales region from the disconnected table in a slicer
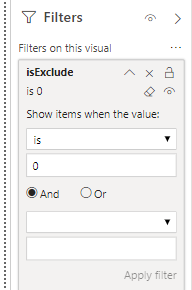
And finally, put a filter in the table visualization that says "isExclude is not 1"
To follow the rest of the blog post:
Step 3:
Now we can create a new measure “Sales Amount (Disconnected)” which will sum up the SalesAmount for all the regions that are not excluded.
1 2 3 4 5 6 7 8 9 10 11 | Sales Amount (Disconected) =VAR FilterRegions = FILTER ( FactInternetSales, [isExclude] =0 )RETURN CALCULATE ( sum(FactInternetSales[SalesAmount]), FilterRegions ) |
Step 4:
All right, you should be all set up now now.
As we can see on the visuals below when we select Australia from the slicer all the other regions appart from Australia are displayed.

Step 4 bis:
If instead of creating a new measure you want the “Exclude Slicer” to work on your visual for any measures you just need to add the “isExclude” measure into the visual filter pane.
0 comments:
Post a Comment
Note: Only a member of this blog may post a comment.